A Tool in Progress: The Sub-National Fragility Index
Mar 13, 2018
.") Is it possible to build a fragility index that is truly useful as a tool for day-to-day development programming on the ground? That’s what we’re trying in Nigeria.
Is it possible to build a fragility index that is truly useful as a tool for day-to-day development programming on the ground? That’s what we’re trying in Nigeria.
Indices of state fragility already exist. For example, the Fragile States Index, published by the Fund for Peace, and the State Fragility Index, published by the Center for Systemic Peace, both draw on a mix of datasets and analysis to measure state fragility. And though their methodologies are unique, they often reach similar conclusions: in 2017, their lists of the top 10 most fragile states were nearly identical.
Published yearly, these indices are thought-provoking in their own right and do serve certain purposes, however, they don’t meet the practical needs of development professionals. We program in real-time and need data that gives us equally timely indications of shifts in fragility in the countries where we work. Additionally, it’s questionable how useful existing indices are in predicting instability, given that what they essentially do is evaluate past events. There was much handwringing, for example, when none of the available indices foresaw the Arab Spring. Finally, they are not granular enough. National data often mask local realities, and it is invariably these local realities that development professionals must address in their programming.
Not a Crystal Ball Exactly…
Our programming must deliver locally calibrated solutions to economic, social, and political drivers of fragility. But how can we do this without measurements and indicators that are just as targeted as the solutions we seek to provide? DAI’s Center for Secure and Stable States, or CS3, set out to tackle that problem by piloting a “Sub-National Fragility Index.”
If the sub-national index is to inform effective programming in fragile states, it must have four key features:
- It has to be flexible and customizable, allowing it to be tailored to local contexts;
- It has to be timely, with a short suspense between data collection and results;
- Its readouts must be more frequent than yearly; and
- It should be an early warning indicator of potential threats to stability.
The solution CS3 piloted—in collaboration with mobile surveyor GeoPoll—is a text message-based survey administered on a rolling basis in the northeastern states of Nigeria: Adamawa, Borno, and Yobe. The idea is to test a set of questions that measure fragility by means of citizen perceptions at the provincial level. Such perceptions are then compared against objective measures of stability‚ in this case events recorded in the Armed Conflict Location & Event Database (ACLED).
Are there shifts in public perceptions before, during, and after increases in violence and instability at the sub-national level that could indicate shifts in fragility? We developed 26 questions concentrating on people’s perceptions of complex issues including education, rule of law, optimism, stability, security, peace, land use, and economic outlook. The survey was administered in the three states over 12 weeks.
The Lessons Learning
There were plenty of ACLED events to juxtapose against the data collected in the pilot survey—events both horrific, such as a bombing in Borno, and uplifting, such as the release of the Chibok schoolgirls. However, the citizen perceptions measured in the survey remained relatively constant. Responses to questions on political violence, optimism, feelings toward police, and even perceptions of peace were consistently positive and are stable across time and demographics. Even in Borno, which experiences the highest number of terror incidents according to ALCED datasets, the responses to our questions on issues related to fragility remained consistent, positive, and strikingly similar to responses from the other two states.
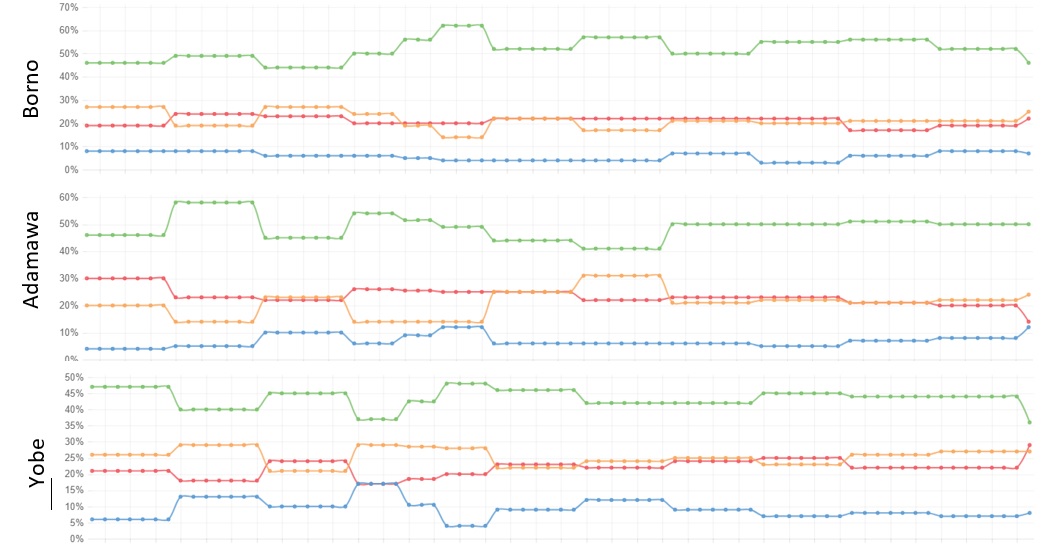
Responses to the survey question, 'Which is closest to your view on violence in politics?' Green: It's never justified; Red: It's at times necessary for a just cause; Orange: Should be used if beneficial; Blue: Other
In addition to our preliminary findings we learned several lessons through this initial survey that will help us refine the tool:
- First, public opinions regarding stability and security are quite steady week to week, even in the face of dramatic violence. While it was tempting to think we could pinpoint shifts on a more granular basis, it makes more sense to move to a monthly schedule.
- Second, while responses were consistent, there were indications of variation within sub-populations. However, these differences weren’t statistically significant, which could be due to the small sample size for sub-populations. Fielding the index monthly would allow us to increase the sample size without incurring additional costs. This move will help us determine if shifts in the perceptions of particularly vulnerable populations—such as women and youth—may be better indicators of instability.
- Third, based on this pilot we can modify our questions to identify other indicators that may be more sensitive and responsive to shifts in perceptions of violence and fragility. Leaning on our technical expertise and our experience in other geographies, we hope to refine the questions in a way that systematically localizes and enhances the tool.
We’ll be making these adjustments in the months ahead and will report back on our progress.